Elsie™ is an uncommon commercial-grade lumped-element ("L-C") electrical filter design and network
analysis program, directed toward the engineer, technician or hobbyist involved in that line of work.
- The free Student Edition of Elsie is quite adequate for student use or for use by small manufacturing operations.
But with the key it operates in the more capable Professional Edition.
- The principal difference between the Student Edition and the Professional Edition of Elsie lies in the Student
Editions's limit on the number of network components. In addition, the editing library of manually-entered components
is restricted somewhat in the Student Edition to inductors, capacitors, resistors, and series and shunt jX entries. No
lines, stubs, transformers or coupled inductors are allowed. The Professional Edition allows those components and
others to be manually entered.
- That "number of network components" is 7 for the Student Edition and 41 for the Professional Edition. For filter
design, the order is 7 for the Student Edition and 21 for the Professional Edition excepting Bessel and Gaussian which
are limited to 10 (because the normalized values are from a lookup table).
- Elsie is 32-bit Windows® electrical filter design software nicely written to help engineers design and analyze
lumped-element filters in the audio through microwave range. Thanks to the standard interface, all of the various
aspects of program operation are quite easy to use. Most options are selected by clicking on buttons. No scripts. Not a
DOS lookalike. Schematics are drawn correctly, not using text characters.
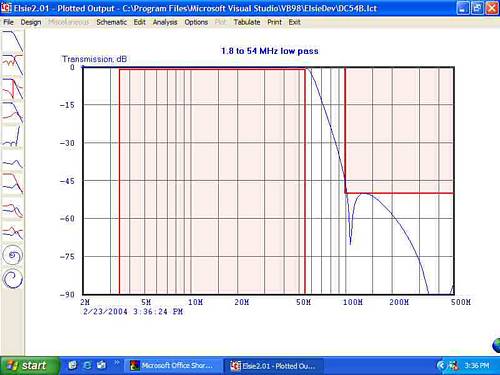
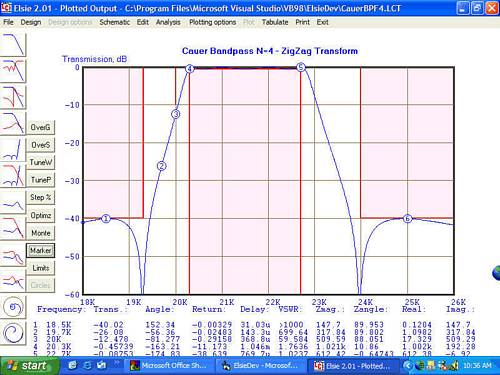
- This filter design program designs and then analyzes filters with a wide variety of topologies and families and
with specified orders, bandwidths, impedances and the like. The usual filter families of Butterworth, Chebyshev, Cauer
(including the zig-zag transform), Bessel, Gaussian, Constant-K and M-derived are covered.
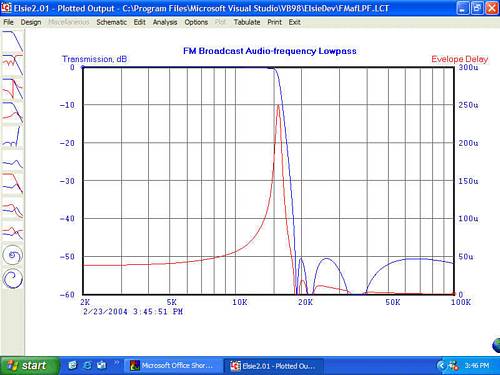
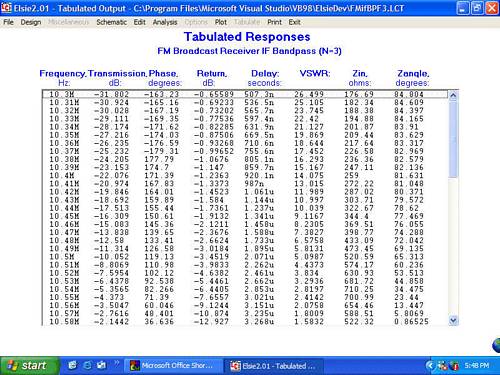
- The quality of the screen graphics is very high (dependent on your monitor), and include transmission (S21), return
loss (S11), transmission with its angle, group (envelope) delay, VSWR, input impedance and its angle and more (selected
pairs of these items).
- To maintain this level of quality, the outputs to the printer are not "screen dumps" but instead are from a
separate set of dedicated routines which write directly to the printer. The quality of the graphics as delivered by the
printer will be limited only by that printer and the number of test frequency steps used (up to 2048 steps).
- The graphics items automatically adjust themselves to various resolution screens. As an example, the size of the
plot on monitors of 800x600, 1024x768 or 1280x1024 is the same in terms of centimeters or inches. Aspect ratio of the
screen display can be adjusted so Smith Charts look circular on any monitor width-to-height ratio.
- Markers can be placed on the plots. These reveal the data for that plot at the markers' frequencies. Up to eight
markers can be defined. The data for each frequency is shown in tabular form beneath the plot.
- Limits areas can also be placed on the plots. These mark the "out of bounds" area and are useful as a tool to
assist in a manual tuning operation. Up to ten limits areas can be placed on each plot. They are used as part of the
optimization routine to generate an error value.
- It has a Monte Carlo routine and an extension of that forms the optimizer.
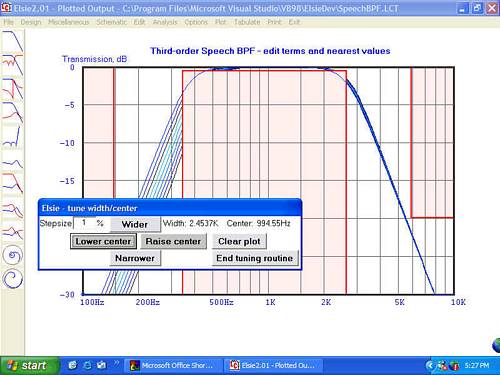
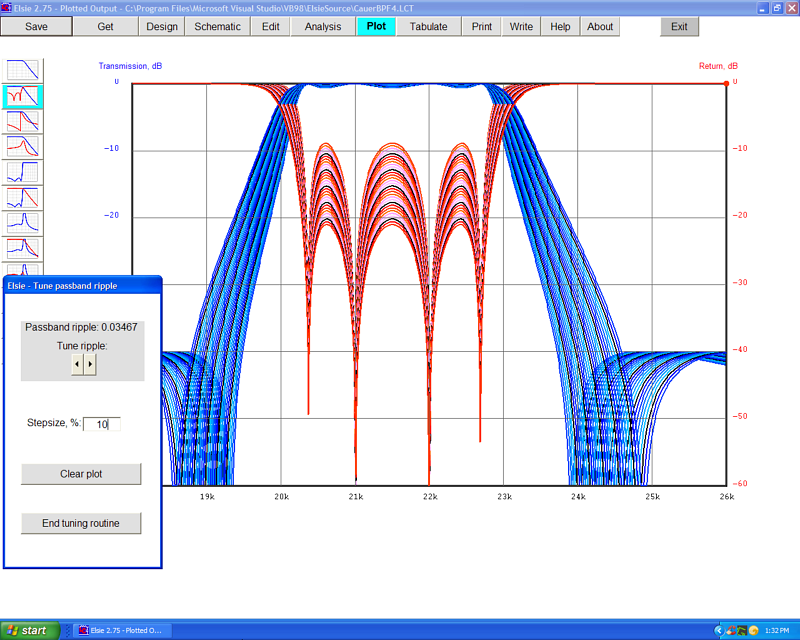
- You can tune the width and/or center of a filter Elsie designed. Those items are adjusted using the mouse; the
filter is immediately redesigned, reswept and replotted. Unique and fast - milliseconds per step.
- You can select an item and adjust its value - "tune" it - by clicking on buttons. Because the filter design and
analysis routines are very closely coupled, the results are seen immediately on the screen. There is no need to go to
another program or routine to see the effects of finite inductor Q, as an example.
- The tuning modes in conjunction with the optimizer and limits areas allow you to easily see the effect of adjusting
a particular part, or to achieve a response shape meeting some unusual requirement.
- It stores up to ten plots ("overlays") which can be recalled for comparison. Develop a filter, store the data plots
for it, make changes to the filter, and then recall any of those overlays. The data is stored on the hard drive and so
is available in future sessions, not just while the program is currently running. They'll be overlaid on top of your
current graph for quick visual comparison of designs. This facilitates a very fast visual comparison of different
families or orders or other network differences. See the "overlay example" graphic below.
- When a plot is showing, put the cursor on the plot and press the mouse button to see a line of data at the bottom
of the screen showing all of the information for the frequency corresponding to the cursor position. See the
corresponding data (all of the data) at the bottom of the screen. Move the cursor and the data line reveals the data
for that new frequency. Of course that data is also available in tabular form.
- It has a very flexible routine for installing the nearest 5% values (all parts, inductors only, capacitors only or
one of those while maintaining resonant frequencies of L-C pairs). This latter feature is especially helpful in the
design of Cauer filters.
- It has a library of components (including transmission lines and stubs, transformers, arbitrarily-coupled
inductors, and resistors, as well as unique-to-Elsie parts) which can be added onto or inserted into the schematic
manually so you can see the result. For example you can add a piece of coax (specify the impedance and length) to the
filter and see what changes result.
- It allows manual entry of any of the library components or changing them once the filter has been entered. Any of
those library components can be installed or their values changed.
- It allows changing some elements to their distributed (coax) equivalents. Easily change a series inductor to a
high-impedance line, for example. Or a shunt capacitor to a low-impedance line.
- You can save all of the data presented as a set of files in two-column (frequency, data) for analysis by another
program, for example an FFT routine to see a waveform spectrum. There are neither headers nor footers on those files to
confuse the issue. Up to nine such sets of files may be saved; these are the same files used to present the
overlays.
- It writes schematic files for LTspice (from Linear Technology Corp.).
[Note: Tonne Software has no connection with Linear Technology Corp.]
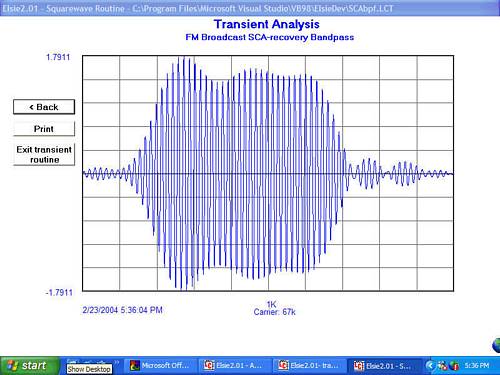
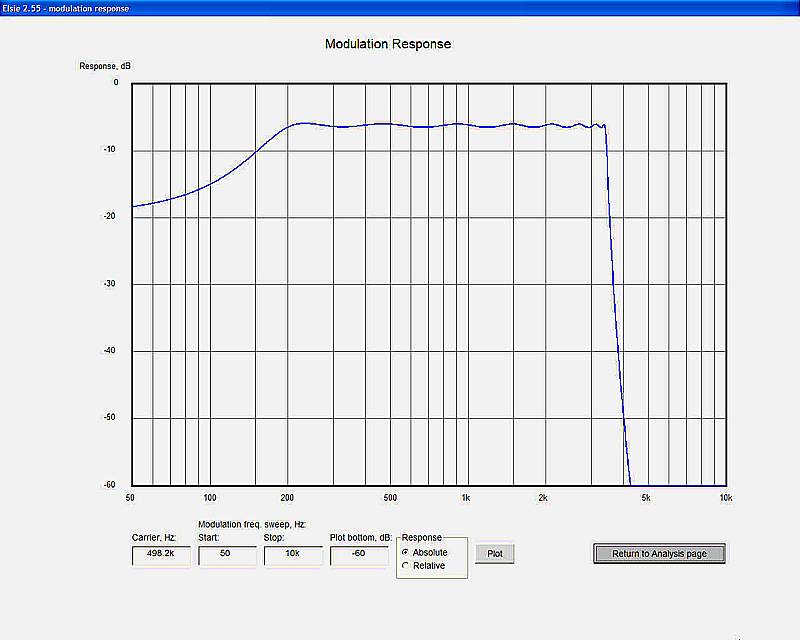
- It does time-domain analysis as well as analysis in the frequency domain. You can observe the expected output from
a network when it has been excited with a square wave or a tone-burst, and even see the envelope of a burst. See the
"tone-burst" graphics below. (The envelope of the tone-burst is perhaps easier to comprehend visually. This is believed
to be unique with Elsie in the filter design program field.)
- The normalized-values for a design are available, along with the option to send them to the printer; see graphic
below.
- This program is designed to approach the capabilities of the complex do-everything programs while retaining the
ease of use of lesser programs.
- The program requires a monitor with a resolution of 800x600 or better. Graphics are auto scaled to accommodate
higher monitor resolutions (which are recommended).